The only engine with graph-wide scanning and integrated AI for:
Finding Connections in a Universe of Data
Rocketgraph allows an analyst to play “20 questions” with the biggest, most complicated datasets on the planet.
Speed
Run graph analytics that go dozens of layers deep at speeds hundreds of times faster than ever before.
Scale
Work with hundreds of billions of nodes and edges — analysis that used to take days to run or crash your machine.
Secure
Protect your most important analyses with security mechanisms co-designed with the U.S. Department of War.
Smart
Built-in GenAI gets data science done faster with pluggable LLMs — including your private LLM.
Put your hardest-to-solve problems on the launch pad
Expose the Network. Stop the Loss.
Organizations lose an estimated 5% of annual revenue to fraud across all sectors.
Rocketgraph builds an entity‑centric graph of customers, devices, merchants, and sessions to reveal anomalous links, mule clusters, and high‑velocity patterns in real time.
KPI: Net fraud loss rate (basis points of TPV (total payment volume) at acceptable rate.
Resolve Entities. Reveal Laundering. Reduce Risk.
Global AML/KYC/sanctions enforcement actions totaled about $4.6B in 2024, with repeated findings of monitoring and escalation failures.
Rocketgraph resolves entities across KYC, payments, and watchlists, then runs continuous link analysis to expose intermediaries, circular flows, and typologies.
KPI: SAR (suspicious activity report) conversion rate (alerts-to-filed/validated SARs, %) and median investigation time.
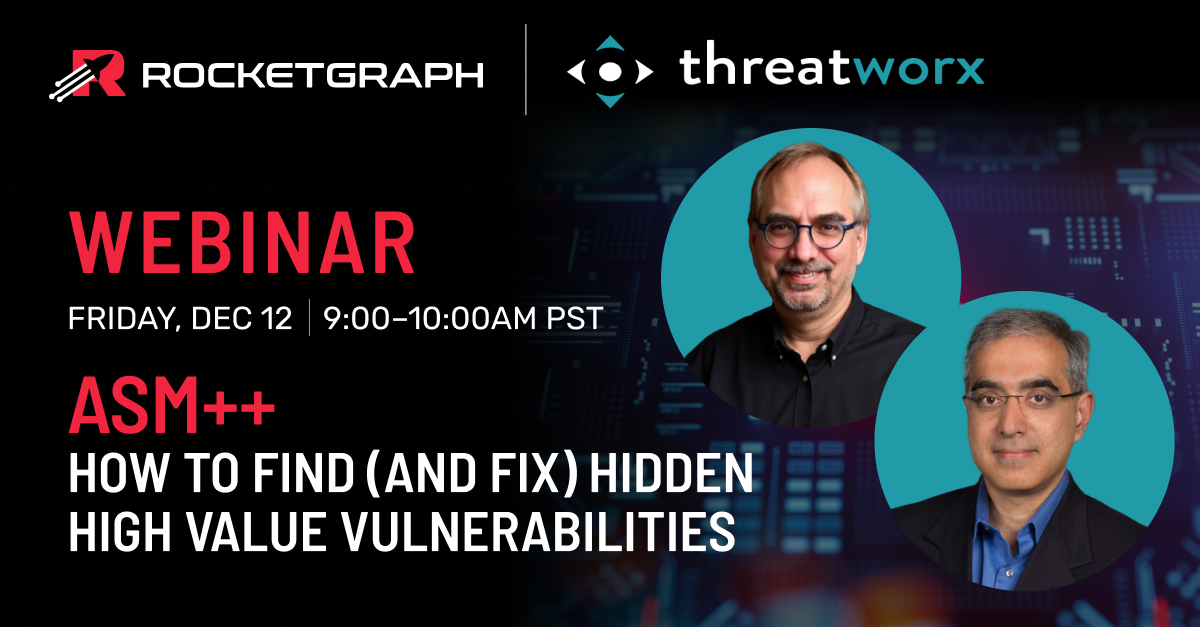
BEAT THE EXPLOIT CLOCK: From CVE Chaos to KEV Control
28.3% of new CVEs (common vulnerabilities and exposures) were exploited within one day of disclosure in Q1 2025.
Rocketgraph prioritizes exposures by mapping assets/SBOM to KEV and live exploit signals, elevating items with the greatest blast‑radius and business impact.
KPI: KEV (known exploited vulnerabilities) remediation SLA adherence, p95 time‑to‑remediate ratio.
One data model. many sources. no extra database maintenance.


Unstoppable
Combination

"Partnering with Rocketgraph allows IBM Power clients to efficiently leverage graph analytics and gain answers to complex problems involving massive datasets. Rocketgraph xGT graph analytics platform leverages Power10's ability to scale vertically in memory - yielding more answers to important questions much faster." Learn More »
Unnikrishnan Rajagopal
Director of ISV Ecosystem,
GSI and Alliances, IBM Power

Born from a U.S. Department of War project. raised on mission-critical challenges.
Fasten your
seatbelts for
orbital velocity
Take a look at benchmarks comparing Rocketgraph xGT performance to the Neo4j™ graph database.