Rocketgraph Performance Labs
Testing the speed and scale of graph analytics
About the Lab
At Rocketgraph, we pride ourselves on delivering solutions that enable the deepest insights with the fastest speed and scale, with a keen focus on improving outcomes for our customers. We decided to start Rocketgraph Performance Lab (RPL) to create and measure metrics that organizations really need. Productivity. Time to insight. And more.
Our approach to benchmarking
There are three pillars that uphold our approach to benchmarking which ultimately deliver value to our customers. PERFORMANCE which measures speed. Just as important is USABILITY which tracks how easy the product is to use, Finally, FRIENDLINESS; we want to go beyond fast and functional and delight our customers.
Rocketgraph Performance Labs
Testing the speed and scale of graph analytics
About the Lab
At Rocketgraph, we pride ourselves on delivering solutions that enable the deepest insights with the fastest speed and scale, with a keen focus on improving outcomes for our customers. We decided to start Rocketgraph Performance Lab (RPL) to create and measure metrics that organizations really need. Productivity. Time to insight. And more.
Our approach to benchmarking
There are three pillars that uphold our approach to benchmarking which ultimately deliver value to our customers. PERFORMANCE which measures speed. Just as important is USABILITY which tracks how easy the product is to use, FInally, FRIENDLINESS; we want to go beyond fast and functional and delight our customers.
Performance Lab Benchmarks
Ingest Performance
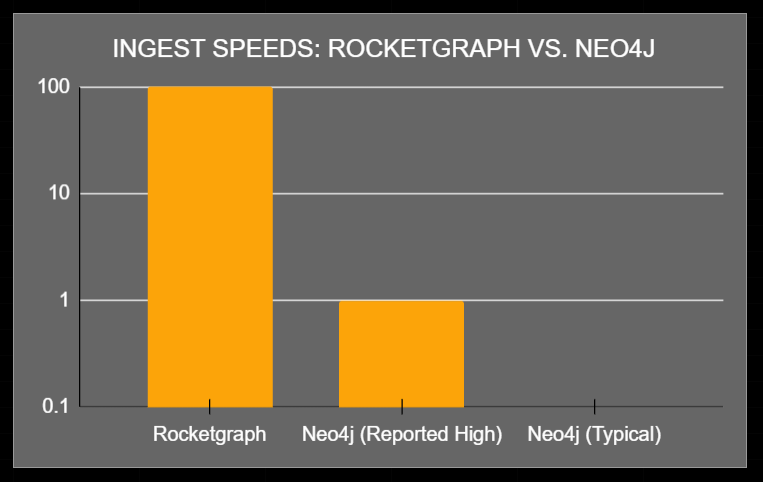
With Rocketgraph’s Hyperload technology, ingestion speeds of up to 100 million attributes per second are possible. Our clients have told us that Neo4j's ingestion rates can be as low as a few hundred nodes / edges per second, even when utilizing multiple processes. So we compared both. The result? The Rocketgraph ingest was up to 1000x faster.
Ingest Speeds: Rocketgraph vs. Neo4j
BFS Algorithm Performance
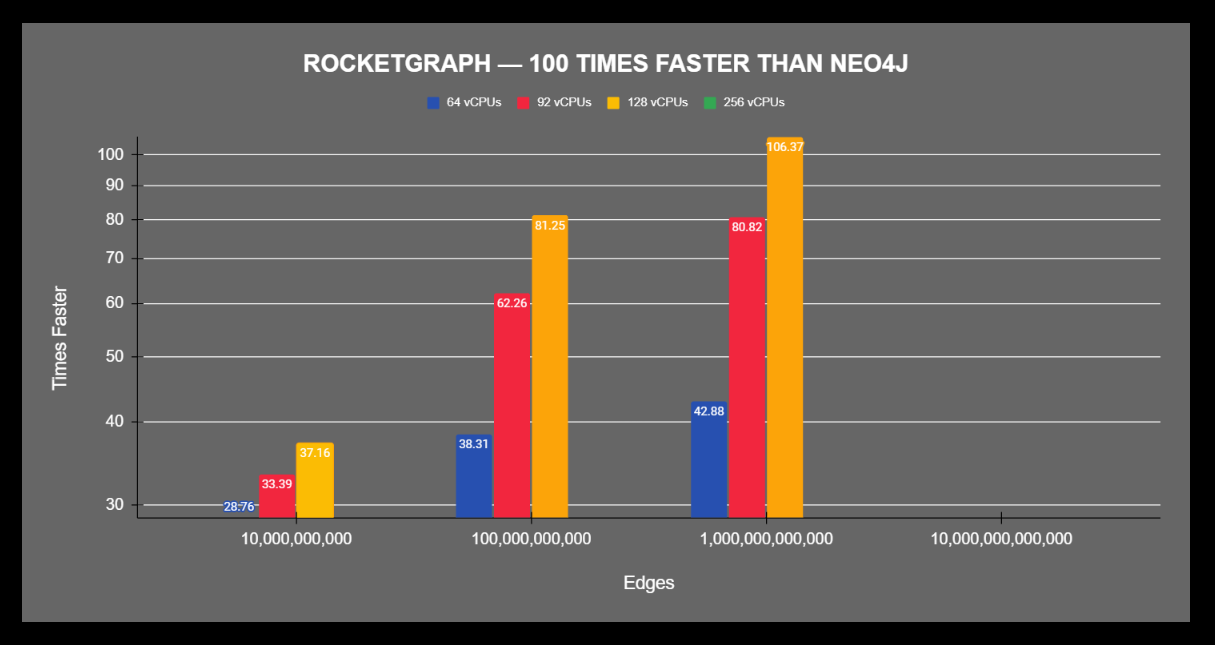
Breadth-first search (BFS) is a core graph algorithm that explores nodes level by level and is often used as a benchmark to test the scalability of graph systems. Rocketgraph holds four patents for graph algorithms specifically designed to scale without compromising performance. In RPL’s independent testing, 64, 92, 128, and 256 vCPU environments were configured to run BFS benchmarks against Neo4j. The chart below shows how many times faster Rocketgraph is when compared to Neo4j (with a logarithmic scale on the Y-axis). It should be noted that RPL’s attempt to test Neo4j at 256 vCPUs was unsuccessful; query times went to infinite and the machine crashed.
“A query that runs for 3 days on other technology completes in 40 minutes on Rocketgraph”
Rocketgraph: 100 Times Faster Than Neo4j
Temporal Triangles Performance
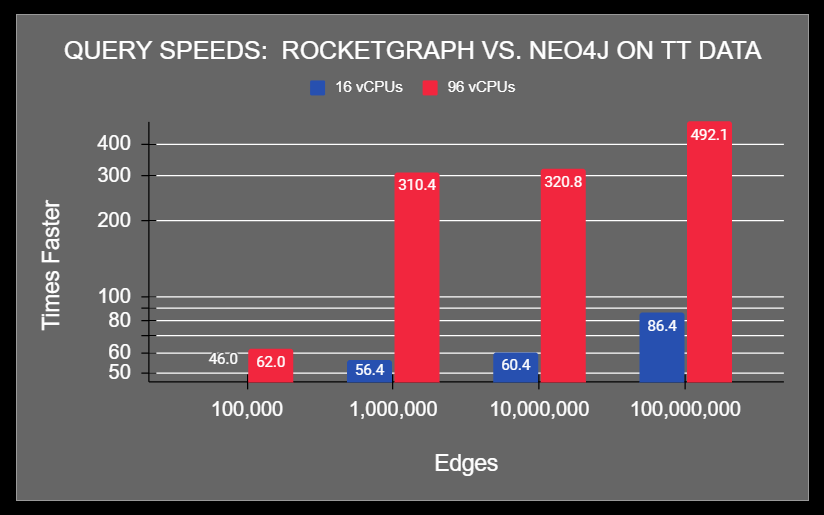
The Temporal Triangles (TT) query serves as an ideal benchmark for property graph databases by identifying directed 3-cycles where timestamps increase monotonically and fall within a specified time window. In our tests at the lab, Rocketgraph was an average of 500x faster than Neo4j, with the speedup scaling linearly with the number of vCPUs. To learn more read the temporal triangle blog post.
“Rocketgraph was 500x faster than Neo4j with the speedup scaling linearly.”
Rocketgraph: 500x Faster Than Neo4j
What’s Happening at the Lab
Columbia University offers students a semester-long course in analysis with Rocketgraph and other tools. When they began the course, it took students a few days to get up and running. We learned from this and improved their experience so that today they can be up and running in minutes.
The Technology Advancement Center (TAC) offers an Operational Technology Bootcamp which provides cyber threat analysts with hands-on training and real-world scenarios analyzing device telemetry data; the whole class is being taught using Rocketgraph.
Edge computing represents a new domain for analytics. Today, the challenge is in bringing analytics closer to the edge. The team at Sourcecode is testing Rocketgraph to answer an important question: how well can we partner to deliver a petabyte scale graph in edge computing?
Discover More
30 Day Free Trial, bring your own data or use ours.
Learn about his mission for Rocketgraph and the industry.
How GenAI +HPC Accelerate Graph Analytics Adoption.


